


Acquisition of emotional vocabulary for smart home fans
Extraction of emotional vocabulary for smart home fans
Traditional manual data collection methods for acquiring product images and user reviews are subject to several limitations: low efficiency due to manual browsing and saving, limited coverage often restricted to static content from a few platforms, inability to capture dynamic content (e.g., JavaScript-loaded pagination) reliably, poor data consistency from manual organization, and insufficient timeliness for tracking new products or sentiment shifts.
In contrast, web crawling technology effectively addresses these limitations through automation. It facilitates continuous data scraping from diverse sources, including e-commerce platforms (e.g., Amazon, Taobao), social media, and specialized forums. This approach enables precise extraction of image links and user evaluations.
In this study, we employed web crawling to collect 12,571 raw reviews and associated product images using keywords such as “smart home products” and “home fans.” A rigorous data cleaning pipeline was then implemented to ensure data quality. This included: (1) removing duplicate entries and advertisements; (2) filtering out non-textual content and robot-generated reviews; and (3) standardizing linguistic expressions, including correcting spelling errors and translating non-English comments into English.
From the cleaned corpus, high-frequency vocabulary was statistically analyzed, and descriptive adjectives were systematically extracted as candidate emotional descriptors. A panel of three domain experts conducted a rigorous manual validation process to finalize the emotional lexicon. The validation was based on the pre-defined criteria detailed in Table 3, which were calibrated using the actual high-frequency terms obtained from the analysis. These criteria included contextual relevance, emotional polarity, and emotional intensity. Any term with low contextual relevance or exhibiting disagreement among experts was discarded. The final consolidated emotional lexicon served as a reliable foundation for analyzing user emotional needs.
This methodology, grounded in empirically derived high-frequency terms, provides end-to-end support from initial market insight to technical validation, facilitating a transition from experience-driven to data-driven design decisions.
Following data collection, image samples were selected based on visual similarity and high clarity. A subset comprising four-fifths of the qualified images was selected as the test set. During this process, images with inconsistent perspectives were eliminated, and all image dimensions were standardized. A sample of 100 household smart fan appearances is displayed and analyzed on a single plane in Fig. 6.

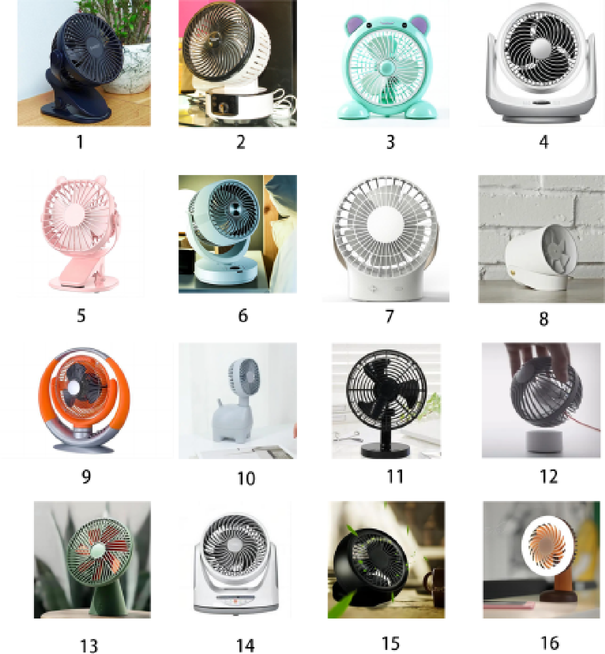
Perceptual pictures of domestic household smart fans.
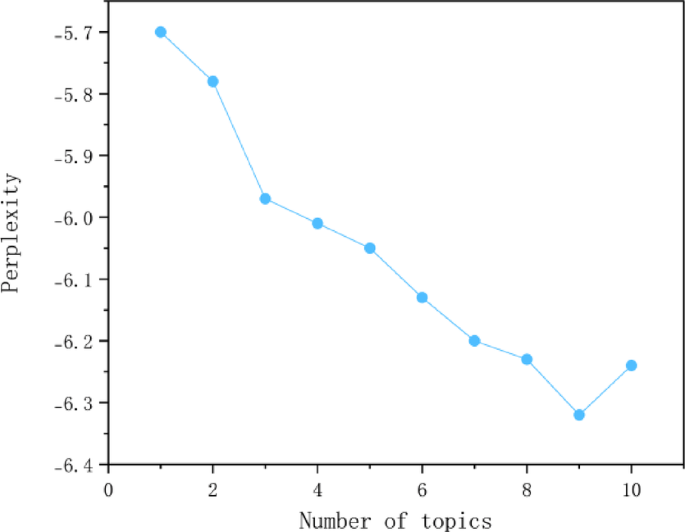
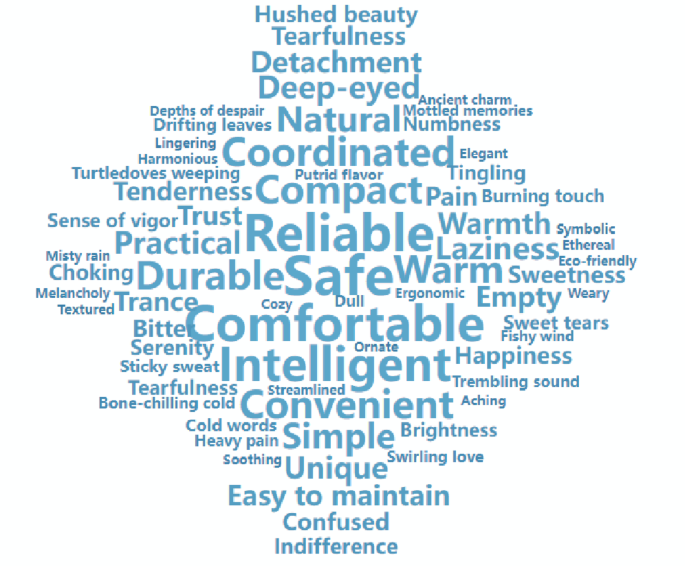
Concurrently, sentiment-descriptive texts for smart home fans, obtained via web crawling, were integrated and analyzed using a Latent Dirichlet Allocation (LDA) topic model to identify key sentiment descriptors 29,31. This analysis identified 10 distinct topics, as shown in Fig. 7. The corresponding topic visualization, presented in Fig. 8, clearly displays the affective vocabulary associated with each theme along with their respective weight distributions.
LDA theme visualization results.
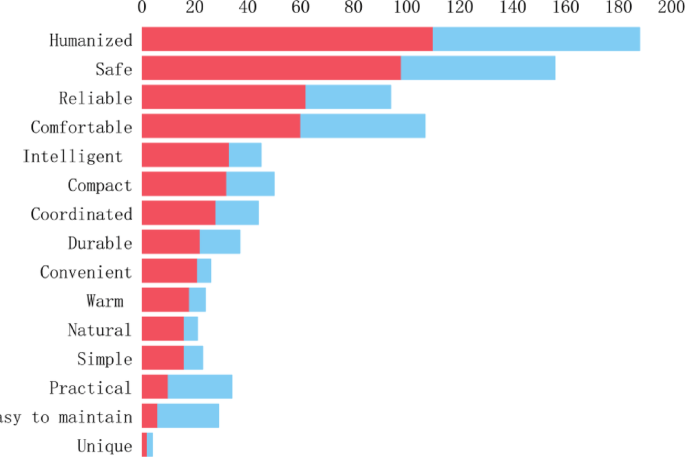
From this analysis, 70 affective engineering-related descriptors were extracted (Fig. 9), forming the foundation for a standardized affective lexicon. Subsequently, the top 15 affective terms by weight were selected through expert panel discussions; their specific distribution is provided in Table 4.
Relevant Perceptual Engineering Descriptors.
Core sentimental vocabulary acquisition based on FAHP
The sheer diversity of emotional vocabulary associated with smart home fans can complicate the evaluation process for researchers. Therefore, to streamline the evaluation, a fuzzy hierarchical model was constructed based on the previously analyzed 15 emotional vocabulary terms, and the core emotional vocabulary was calculated. This approach effectively simplifies the evaluation of factors related to smart home fans.
The criterion layer of the model consists of four primary indicators: emotional needs, functional needs, sensory needs, and operational needs. At the solution layer, the emotional needs indicator is defined by “sense of security,” “warmth,” “user-friendliness,” and “comfort.” The overall structure of this hierarchical model for smart home fan emotional vocabulary is depicted in Fig. 10.
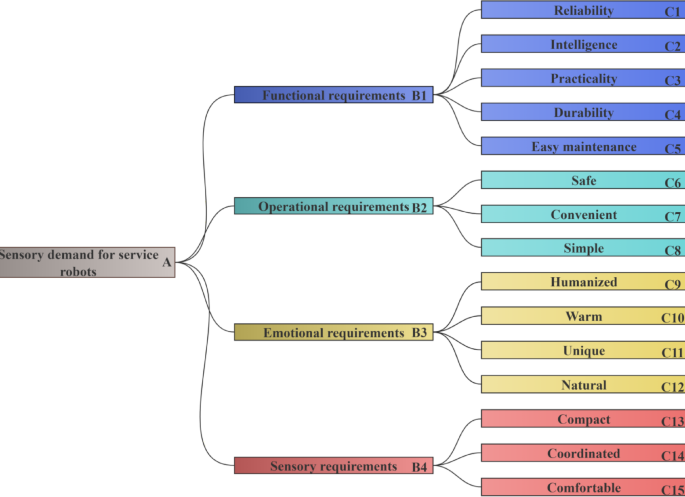
Hierarchical model of perception vocabulary for household smart fans.
Based on the affective vocabulary hierarchical model for smart home fans (Fig. 8), 15 experts in relevant fields were invited to rate the importance of each influencing factor. A judgment matrix was constructed through pairwise comparisons of the impact of each factor on the system objectives. Following the computational procedures defined in Eqs. (1) and (2), the weight values for each smart home fan requirement were calculated sequentially, and fuzzy consistency checks were performed concurrently. Subsequently, a fuzzy judgment matrix for the criterion layer was established. The results of the expert scoring and weight calculations are presented below.
\(A = \left[ {\begin{array}{*{20}c} {} & {B1} & {B2} & {B3} & {B4} \\ {B1} & {{0}{\text{.5}}} & {{0}{\text{.7}}} & {{0}{\text{.4}}} & {{0}{\text{.6}}} \\ {B2} & {{0}{\text{.3}}} & {{0}{\text{.5}}} & {{0}{\text{.3}}} & {{0}{\text{.6}}} \\ {B3} & {{0}{\text{.6}}} & {{0}{\text{.7}}} & {{0}{\text{.5}}} & {{0}{\text{.7}}} \\ {B4} & {{0}{\text{.4}}} & {{0}{\text{.4}}} & {{0}{\text{.3}}} & {{0}{\text{.5}}} \\ \end{array} } \right],w = \begin{array}{*{20}c} {B1} \\ {B2} \\ {B3} \\ {B4} \\ \end{array} \left[ {\begin{array}{*{20}c} {{0}{\text{.2833}}} \\ {{0}{\text{.2}}} \\ {{0}{\text{.3333}}} \\ {{0}{\text{.1833}}} \\ \end{array} } \right]\)
Construct a fuzzy judgment matrix for each sub-criterion level, and derive the matrix score and weight calculation results for B1 as follows:
\(B_{1} = \begin{array}{*{20}c} {} & {C1} & {C2} & {C3} & {C4} & {C5} \\ {C1} & {{0}{\text{.5}}} & {{0}{\text{.4}}} & {{0}{\text{.4}}} & {{0}{\text{.4}}} & {0.6} \\ {C2} & {0.6} & {{0}{\text{.5}}} & {0.6} & {0.7} & {0.7} \\ {C3} & {0.6} & {{0}{\text{.4}}} & {{0}{\text{.5}}} & {0.6} & {0.7} \\ {C4} & {0.6} & {0.3} & {{0}{\text{.4}}} & {{0}{\text{.5}}} & {0.7} \\ {C5} & {{0}{\text{.4}}} & {0.3} & {0.3} & {0.3} & {{0}{\text{.5}}} \\ \end{array} ,w = \begin{array}{*{20}c} {C1} \\ {C2} \\ {C3} \\ {C4} \\ {C5} \\ \end{array} \left[ {\begin{array}{*{20}c} {{0}{\text{.18}}} \\ {{0}{\text{.26}}} \\ {{0}{\text{.23}}} \\ {{0}{\text{.2}}} \\ {{0}{\text{.13}}} \\ \end{array} } \right]\)
Construct a fuzzy judgment matrix for each sub-criterion level, and derive the matrix score and weight calculation results for B2 as follows:
\(B_{2} = \begin{array}{*{20}c} {} & {C6} & {C7} & {C8} \\ {C6} & {{0}{\text{.5}}} & {{0}{\text{.6}}} & {{0}{\text{.7}}} \\ {C7} & {{0}{\text{.6}}} & {{0}{\text{.5}}} & {{0}{\text{.6}}} \\ {C8} & {{0}{\text{.3}}} & {{0}{\text{.6}}} & {{0}{\text{.5}}} \\ \end{array} ,w = \begin{array}{*{20}c} {C6} \\ {C7} \\ {C8} \\ \end{array} \left[ {\begin{array}{*{20}c} {{0}{\text{.4333}}} \\ {{0}{\text{.2667}}} \\ {{0}{\text{.3}}} \\ \end{array} } \right]\)
Construct a fuzzy judgment matrix for each sub-criterion level, and derive the matrix score and weight calculation results for B3 as follows:
\(B_{3} = \begin{array}{*{20}c} {} & {C9} & {C10} & {C11} & {C12} \\ {C9} & {{0}{\text{.5}}} & {{0}{\text{.4}}} & {{0}{\text{.6}}} & {{0}{\text{.6}}} \\ {C10} & {{0}{\text{.6}}} & {{0}{\text{.5}}} & {{0}{\text{.6}}} & {0.7} \\ {C11} & {{0}{\text{.4}}} & {{0}{\text{.4}}} & {{0}{\text{.5}}} & {{0}{\text{.6}}} \\ {C12} & {{0}{\text{.4}}} & {0.3} & {{0}{\text{.4}}} & {{0}{\text{.5}}} \\ \end{array} \quad w = \begin{array}{*{20}c} {C9} \\ {C10} \\ {C11} \\ {C12} \\ \end{array} \left[ {\begin{array}{*{20}c} {{0}{\text{.2667}}} \\ {{0}{\text{.3167}}} \\ {{0}{\text{.2333}}} \\ {{0}{\text{.1833}}} \\ \end{array} } \right]\)
Construct a fuzzy judgment matrix for each sub-criterion level, and derive the matrix score and weight calculation results for B4 as follows:
\(B_{4} = \begin{array}{*{20}c} {} & {C13} & {C14} & {C15} \\ {C13} & {{0}{\text{.5}}} & {{0}{\text{.4}}} & {{0}{\text{.4}}} \\ {C14} & {{0}{\text{.6}}} & {{0}{\text{.5}}} & {{0}{\text{.4}}} \\ {C15} & {{0}{\text{.6}}} & {{0}{\text{.6}}} & {{0}{\text{.5}}} \\ \end{array} \quad w = \begin{array}{*{20}c} {C13} \\ {C14} \\ {C15} \\ \end{array} \left[ {\begin{array}{*{20}c} {{0}{\text{.2667}}} \\ {{0}{\text{.3333}}} \\ {{0}{\text{.4}}} \\ \end{array} } \right]\)
The consistency ratio (CR) values for factors A, B1, B2, B3, and B4 were calculated as 0.0313, 0.032, 0.0444, 0.0188, and 0.0222, respectively. All values are below the 0.1 threshold, confirming that the judgment matrices passed the consistency test. The composite weight values for the factors were obtained by multiplying the first-level weight values by the corresponding second-level weight values. These composite weights were then ranked; the results are presented in Table 5.
The weighting of emotional factors for smart home fans helps designers prioritize directions that align with consumer needs, thereby improving overall design efficiency. In this study, nine key emotional factors with weights exceeding 0.6 were selected and applied to the design of smart home fans. Subsequently, these factors were clustered into conceptual dimensions to facilitate the construction of an evaluation matrix that links emotional needs to smart fan design characteristics.
Specifically, “Intelligence” reflects technological sophistication, “Practicality” denotes effective functional implementation, and “Safety” constitutes the foundational element for user trust. These three elements collectively form the “Intelligent Stability” dimension, which conveys technological credibility and ensures stable, reliable functionality. This dimension establishes a design principle centered on intelligent reliability.
“Humanization,” “warmth,” “comfort,” and “harmony” represent a progressive emotional experience: humanization pertains to adaptive interaction, warmth cultivates an emotional ambiance, comfort addresses physiological sensations, and Harmony emphasizes overall consistency. Together, they constitute the “Emotional Comfort” dimension, which reflects a comprehensive response to users’ psychological and physiological needs, conveying emotional warmth in human–machine interaction.
At the cultural expression level, “Uniqueness” and “Harmony” are complementary: Uniqueness emphasizes the distinctiveness of Miao cultural elements, while Harmony focuses on their integration with modern product forms. Together, they define the “Harmonious Charm” dimension, which preserves the traditional cultural spirit while achieving a harmonious unity within contemporary home contexts.
In summary, the nine affective terms are integrated into three core design dimensions: “Intelligent Stability,” “Emotional Comfort,” and “Harmonious Charm.” This framework provides a theoretical foundation and practical guidance for the emotional design of smart home fans.
Acquisition of sensory vocabulary characterizing miao style features
Sensory vocabulary acquisition
The precise identification of unique stylistic characteristics is crucial for advancing intelligent technology-driven innovation in the design of traditional Miao patterns. This study adopted an integrated methodology combining the FAHP with questionnaire surveys, implemented in the following steps:
First, a systematic selection of representative pattern samples from traditional Miao motifs was conducted through expert interviews, establishing them as the core subjects of this research. Concurrently, experts from relevant fields—including graphic, product, service, and fashion design—were invited to participate in systematic discussions to define the stylistic characteristics of traditional Miao patterns.
Second, based on the interview findings, feature terms related to the stylistic characteristics of Miao patterns were organized, refined, and consolidated into a definitive set of stylistic descriptors, which are presented in Table 6.
Acquisition of core emotional vocabulary based on FAHP
Building on the identified stylistic characteristics and representative patterns, a questionnaire was developed and distributed to embroiderers and domain experts utilizing systematic surveys and in-depth interviews. The surveys and interviews focused on three core aspects: the stylistic characteristics of Miao traditional embroidery patterns, their intrinsic connection to the profound ethnic culture, and key considerations for the modernization of traditional embroidery.
Following exhaustive data collection and rigorous inductive analysis, a fuzzy hierarchical model was constructed that accurately captures the stylistic features of Miao traditional patterns. This model, illustrated in Fig. 11, provides a theoretical framework for in-depth research.
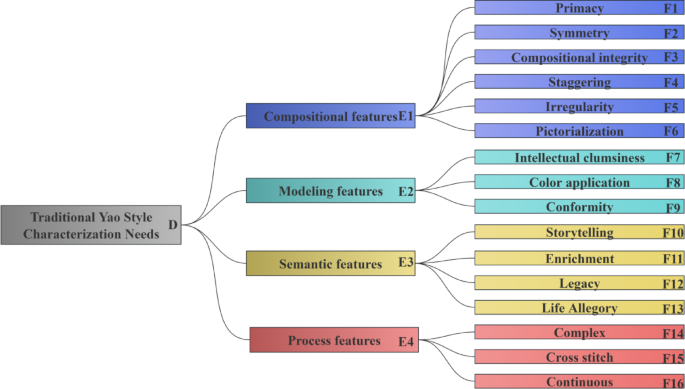
shows the demand levels of Miao ethnic style characteristics.
Following the stylistic feature model presented in Fig. 7, the calculation procedures outlined in steps (1) and (2) were repeated to determine the weight of each factor for the Miao ethnic group’s traditional stylistic features. A fuzzy consistency test was subsequently conducted. Fuzzy judgment matrices were constructed for each criterion level. The primary factor scores and the resulting fuzzy judgment matrices for calculations E1 through E4 are presented below.
$${\text{A}} = \begin{array}{*{20}c} {} & {E1} & {E2} & {E3} & {E4} \\ {E1} & {{0}{\text{.5}}} & {{0}{\text{.8}}} & {{0}{\text{.6}}} & {{0}{\text{.7}}} \\ {E2} & {{0}{\text{.2}}} & {{0}{\text{.5}}} & {{0}{\text{.4}}} & {{0}{\text{.4}}} \\ {E3} & {{0}{\text{.4}}} & {{0}{\text{.6}}} & {{0}{\text{.5}}} & {{0}{\text{.7}}} \\ {E4} & {{0}{\text{.3}}} & {{0}{\text{.3}}} & {{0}{\text{.3}}} & {{0}{\text{.5}}} \\ \end{array} \quad w = \begin{array}{*{20}c} {E1} \\ {E2} \\ {E3} \\ {E4} \\ \end{array} \left[ {\begin{array}{*{20}c} {{0}{\text{.35}}} \\ {{0}{\text{.1667}}} \\ {{0}{\text{.2833}}} \\ {{0}{\text{.2}}} \\ \end{array} } \right]$$
Construct a fuzzy judgment matrix for each sub-criterion level, and derive the matrix score and weight calculation results for E1 as follows:
$$E = \begin{array}{*{20}c} {} & {F1} & {F2} & {F3} & {F4} & {F5} & {F6} \\ {F1} & {{0}{\text{.5}}} & {{0}{\text{.2}}} & {{0}{\text{.3}}} & {{0}{\text{.6}}} & {{0}{\text{.6}}} & {{0}{\text{.4}}} \\ {F2} & {{0}{\text{.8}}} & {{0}{\text{.5}}} & {{0}{\text{.6}}} & {{0}{\text{.7}}} & {{0}{\text{.7}}} & {{0}{\text{.6}}} \\ {F3} & {{0}{\text{.7}}} & {{0}{\text{.4}}} & {{0}{\text{.5}}} & {{0}{\text{.7}}} & {{0}{\text{.7}}} & {{0}{\text{.6}}} \\ {F4} & {{0}{\text{.4}}} & {{0}{\text{.3}}} & {{0}{\text{.3}}} & {{0}{\text{.5}}} & {{0}{\text{.4}}} & {{0}{\text{.3}}} \\ {F5} & {{0}{\text{.4}}} & {{0}{\text{.3}}} & {{0}{\text{.3}}} & {{0}{\text{.6}}} & {{0}{\text{.5}}} & {{0}{\text{.4}}} \\ {F6} & {{0}{\text{.6}}} & {{0}{\text{.4}}} & {{0}{\text{.4}}} & {{0}{\text{.6}}} & {{0}{\text{.6}}} & {{0}{\text{.5}}} \\ \end{array} \quad w = \begin{array}{*{20}c} {F1} \\ {F2} \\ {F3} \\ {F4} \\ {F5} \\ {F6} \\ \end{array} \left[ {\begin{array}{*{20}c} {{0}{\text{.14}}} \\ {{0}{\text{.2267}}} \\ {{0}{\text{.2067}}} \\ {{0}{\text{.1133}}} \\ {{0}{\text{.1333}}} \\ {{0}{\text{.18}}} \\ \end{array} } \right]$$
Construct a fuzzy judgment matrix for each sub-criterion level, and derive the matrix score and weight calculation results for E2 as follows:
$$E = \begin{array}{*{20}c} {} & {F7} & {F8} & {F9} \\ {F7} & {{0}{\text{.5}}} & {{0}{\text{.4}}} & {{0}{\text{.3}}} \\ {F8} & {{0}{\text{.6}}} & {{0}{\text{.5}}} & {{0}{\text{.4}}} \\ {F9} & {{0}{\text{.7}}} & {{0}{\text{.6}}} & {{0}{\text{.5}}} \\ \end{array} \quad w = \begin{array}{*{20}c} {F7} \\ {F8} \\ {F9} \\ \end{array} \left[ {\begin{array}{*{20}c} {{0}{\text{.2333}}} \\ {{0}{\text{.3333}}} \\ {{0}{\text{.4333}}} \\ \end{array} } \right]$$
Construct a fuzzy judgment matrix for each sub-criterion level, and derive the matrix score and weight calculation results for E3 as follows:
$$E = \begin{array}{*{20}c} {} & {F10} & {F11} & {F12} & {F13} \\ {F10} & {0.5} & {0.6} & {0.6} & {0.4} \\ {F11} & {0.4} & {0.5} & {0.6} & {0.3} \\ {F12} & {0.4} & {0.4} & {0.5} & {0.4} \\ {F13} & {0.6} & {0.7} & {0.6} & {0.5} \\ \end{array} \quad w = \begin{array}{*{20}c} {F10} \\ {F11} \\ {F12} \\ {F13} \\ \end{array} \left[ {\begin{array}{*{20}c} {0.2667} \\ {0.2167} \\ {0.2} \\ {0.3167} \\ \end{array} } \right]$$
Construct a fuzzy judgment matrix for each sub-criterion level, and derive the matrix score and weight calculation results for E4 as follows:
$$E = \begin{array}{*{20}c} {} & {F14} & {F15} & {F16} \\ {F14} & {{0}{\text{.5}}} & {{0}{\text{.2}}} & {{0}{\text{.4}}} \\ {F15} & {{0}{\text{.8}}} & {{0}{\text{.5}}} & {{0}{\text{.6}}} \\ {F16} & {{0}{\text{.6}}} & {{0}{\text{.4}}} & {{0}{\text{.5}}} \\ \end{array} \quad w = \begin{array}{*{20}c} {F14} \\ {F15} \\ {F16} \\ \end{array} \left[ {\begin{array}{*{20}c} {{0}{\text{.2}}} \\ {{0}{\text{.4667}}} \\ {{0}{\text{.3333}}} \\ \end{array} } \right]$$
The CR values for features D, E1, E2, E3, and E4 are 0.0225, 0.0438, 0.0432, 0.0222, and 0.0222 respectively, all less than 0.1, passing the one-tailed test. Multiplying the primary weight values by the secondary weight values yields the composite weight values for Miao ethnic style features. These composite weights are then ranked, as shown in Table 7.
###The calculation of weight values for Miao ethnic style characteristics enables designers to concentrate on high-weight stylistic patterns. This approach improves design process efficiency and provides deeper insight into consumers’ core perceptual needs regarding traditional motifs.
Based on this analysis, eight style characteristics with weights exceeding 0.6 were selected for the subsequent construction of the relationship matrix.
Core design feature extraction based on FQFD
Design morphology deconstruction
In affective engineering, morphological decomposition represents a pivotal methodology. It involves analyzing the structure and form of products or systems to reveal the intrinsic connections between affective imagery and physical design attributes 32,33,34. This approach is user-centered, emphasizing the systematic analysis of how design elements (e.g., form, color, materials) influence user emotions and cognition, based on user perception and experience.
The core premise of morphological decomposition involves deconstructing a product into its constituent parts to analyze the form, structure, and function of each element. This process encompasses not only the physical components but also design language, structural relationships, color schemes, and material selection. Through systematic decomposition, designers can acquire a deeper understanding of the intrinsic logic and sensory attributes of a product or system. This facilitates more accurate insights into user needs, reduces development risks, and improves product-market fit .
In this study, a panel of industrial design experts was assembled to conduct a morphological decomposition analysis on a collection of 100 smart home fan images. Through a systematic evaluation, six primary morphological elements were identified: fan guard, fan blades, support frame, fan base, indicator panel, and voice port. Based on this decomposition, ten distinct design archetypes were derived, as illustrated in Fig. 12.
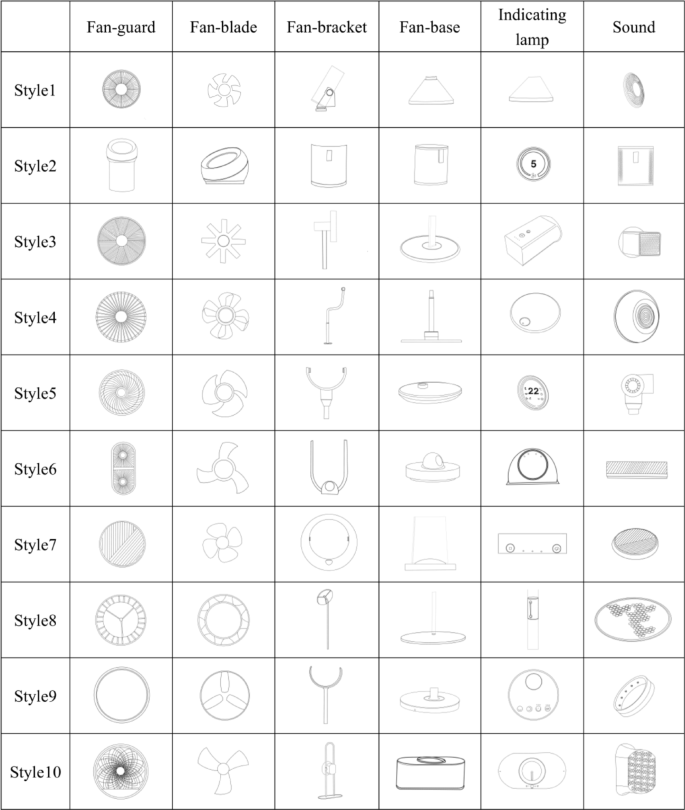
Design features of the smart fan.
Calculation of design feature weights
During the construction of the House of Quality (HOQ) for the Fuzzy Quality Function Deployment (FQFD) process, the six categories of smart home fan design features were positioned as the “Hows” (technical requirements) in the ceiling of the matrix. Concurrently, the top nine user emotional needs, along with their corresponding weight values, were placed as the “Whats” (customer attributes) on the left wall of the HOQ. This configuration enables a systematic analysis of the relationships between design features and user emotional needs.
This mapping model helps designers identify the core design features that most significantly influence user perception, thereby streamlining the design process and enhancing development efficiency 35,36. The complete structure of the HOQ mapping emotional needs to design features for the smart home fan is presented in Table 8.
Finally, based on Table 8, we selected the top four categories of design features to incorporate into the subsequent sentiment prediction matrix.
Calculation of style feature weights
Similarly, the top nine selected emotional vocabulary terms and their corresponding weights are positioned as the “Whats” (customer attributes) on the left wall of the FQFD House of Quality (HOQ). This allows for a systematic analysis of the correlations between user emotional needs and Miao ethnic style characteristics.
This methodology enables designers to accurately identify Miao-style features that align with user emotional preferences, thereby establishing a foundation for subsequent design implementation. The HOQ that maps the relationship between user emotional needs and Miao ethnic style characteristics for smart home fans is presented in Table 9.
Generating and coding design variants
To systematically explore the design space for smart home fans and provide ample training and testing data for the emotional prediction model in this study, we employed a morphological matrix combined with parametric combination methods based on the deconstructed morphological elements. This approach generated a large-scale set of virtual design variants. The specific generation process is as follows:
Step 1: Constructing the Morphological Matrix: Based on the morphological deconstruction outlined in Section “Design morphology deconstruction”, we systematically organized six core morphological elements (fan cover, fan blades, bracket, fan base, indicator panel, voice port) and their 10 design style variants into a morphological matrix. Theoretically, this matrix can generate 10 (fan cover) × 10 (fan blades) × 10 (support frame) × 10 (fan base) × 10 (control panel) × 10 (speaker grille) = 10^6 potential combinations.
Step 2: Feasibility Screening and Combination Reduction: Recognizing that not all theoretical combinations are feasible from an engineering or aesthetic perspective, we engaged a panel of three industrial design experts for preliminary evaluation. Experts eliminated obviously implausible designs based on design principles (e.g., structural stability, stylistic harmony)—such as pairing an ultra-minimalist bracket with an overly complex, heavy base. Following this step, we selected 30,000 visually and conceptually coherent, feasible designs for subsequent emotional prediction.
Step 3: Digital Encoding of Design Concepts: Each generated virtual design was converted into a feature vector for model processing. This vector comprised six discrete categorical variables, each representing a specific stylistic variant (valued 1–10) adopted for a morphological element. For example, a design could be encoded as 1,2,3,5,7,9, denoting its use of a 3rd-category fan cover, 7th-category fan blades, 2nd-category stand, and so on.
Through this approach, we systematically defined and enumerated a virtual design space containing tens of thousands of feasible points. This ensures the CPO-CNN-LSSVM model can learn and predict across a broad, continuous design spectrum, identifying optimal emotional design combinations beyond the initial 100 limited samples. Similarly, the Miao ethnic pattern feature combinations were constructed using this methodology.
Product emotional data prediction based on CPO-CNN-LSSVM
Dataset construction
To evaluate product form characteristics effectively, a panel of 278 evaluators was recruited, comprising 28 experienced designers (10.1%), 90 industrial design professors (32.4%), and 160 industrial design students (57.5%). A Kendall’s W coefficient test demonstrated an inter-rater reliability of 0.89 (p < 0.001), indicating a high level of consistency in the evaluation outcomes.
The three simplified emotional design dimensions—”Intelligent Stability,” “Emotional Comfort,” and “Harmonious Charm”—were adopted as the primary evaluation metrics. The evaluators conducted emotional assessments on 200 sample smart fans to build the foundational dataset. Simultaneously, morphological coding was performed on all samples. The four most prevalent morphological features—stand, fan guard, indicator panel, and fan blades—were selected and integrated into a mapping matrix with the emotional dimensions (Table 10) to enable a systematic analysis of the relationships between morphological characteristics and users’ emotional perceptions.
The CPO-CNN-LSSVM hybrid model was employed to investigate the complex, nonlinear relationship between the design features of innovative fan products and users’ emotional perceptions. During the modeling phase, the input features consisted of design feature scores from 200 smart fan product samples after morphological coding. The output response was the average scores assigned by evaluators across three affective dimensions—”Intelligent Stability,” “Comforting Emotion,” and “Pleasant Rhythm”—for each sample. Adhering to a consistent data partitioning strategy, the 200 samples were randomly allocated into a training set (120 samples, 60%) and a test set (80 samples, 40%). The randomization process employed stratified sampling to ensure distributional similarity between training and test sets on key features (e.g., affective dimension scores), thereby minimizing partitioning bias. Given the limited sample size, cross-validation could introduce excessive computational overhead and deviate from the study’s objective (evaluating model performance on an independent test set). Therefore, a fixed partitioning approach was adopted, though model robustness was validated via Bootstrap resampling (as detailed in Section “Model Performance Validation”). This methodology successfully constructed a predictive model that effectively maps intelligent fan design features to user emotional perceptions 37. All modeling and computational processes were completed in the MATLAB 2024b software environment. The hardware configuration consisted of an Intel i7-14700KF processor and an NVIDIA GeForce RTX 3060 Ti graphics card (8 GB VRAM), running on the Windows 11 operating system.
Parameter setting analysis and sample size adaptive validation
Compared to other optimization algorithms, CPO distinguishes itself through its structural simplicity, robust global exploration capability (enabling compelling exploration of the extensive search space to avoid local minima), a population diversity maintenance strategy based on a novel cyclic population reduction mechanism, and significant convergence acceleration during the late stages of the optimization process.
To validate CPO’s performance, this paper conducts comparative experiments using 23 standard benchmark functions. The experiments evaluate CPO alongside widely used algorithms: Particle Swarm Optimization (PSO), Rime Optimization Algorithm (RIME), and Genetic Algorithm (GA). PSO relies on the cooperative behavior of particle swarms to balance global and local search for optimal parameter identification. However, in high-dimensional hyperparameter optimization, PSO faces challenges in avoiding local optima, particularly when the search space is complex, limiting its global search capability. RIME simulates natural processes by dynamically adjusting the diffusion and aggregation of ice crystal particles, effectively maintaining population diversity and preventing premature convergence. However, RIME converges relatively slowly, especially in the later stages of parameter search, where its incremental convergence mechanism may increase optimization time. GA simulates natural selection and the increase in fitness in biological evolution. Through operations like selection, crossover, and mutation, it continuously optimizes population fitness to obtain the optimal solution ultimately. However, in high-dimensional hyperparameter optimization, GA typically requires more iterations than CPO to reach the optimal solution.
All algorithms share uniform parameter settings: a maximum iteration count of 1000 and a population size of 50. Selected experimental results are shown in Figs. 13–14, where Fig. 13 displays convergence curves for the F1 and F5 functions, and Fig. 14 compares the performance of different optimization methods on these two test functions.
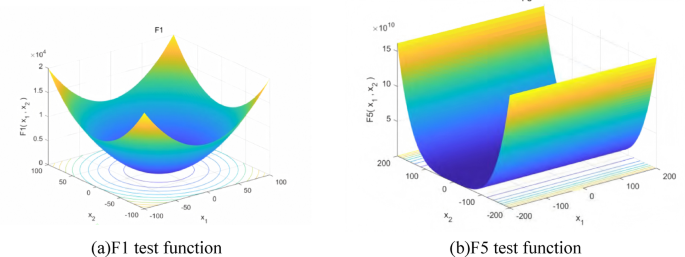
F1 and F5 test functions.
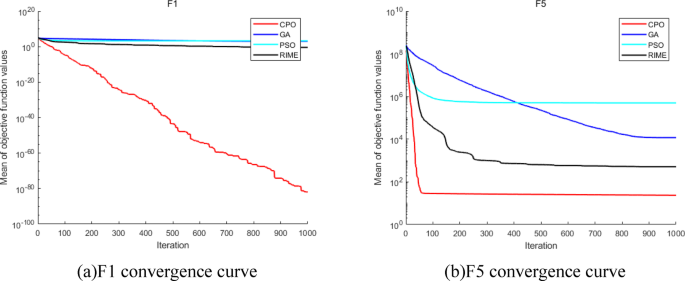
F1 and F5 convergence curves.
Based on the experimental results presented above, the convergence curves for the F1 and F5 evaluation metrics in Fig. 16 demonstrate that the CPO algorithm exhibits superior optimization performance compared to other optimization algorithms. It demonstrates significant advantages during hyperparameter optimization, particularly in terms of global search capability, convergence speed, and stability. Through rapid iteration, CPO can locate optimal solutions within fewer iterations while effectively avoiding overfitting and underfitting.
Before applying CPO for automatic optimization of the CPO-CNN-LSSVM model, the basic architecture and training configuration must be predefined. These structural parameters are typically excluded from the optimization process and must be manually set through preliminary experiments. Key structural elements for the CNN component include convolution kernel size, pooling method, and activation function type; while the LSSVM component requires presetting kernel function type and objective function form. To scientifically determine these configurations, we conducted comparative experiments on the CNN component, with results shown in Table 11. The experiments demonstrate that using the ReLU activation function achieves the lowest RMSE on the validation set and the highest training stability. Regarding LSSVM kernel function validation, Fig. 15 indicates that selecting the RBF kernel achieves the lowest RMSE.
Performance comparison of kernel functions.
The core mechanism of the CPO-CNN-LSSVM model lies in treating the CPO-CNN module as a powerful feature extractor that maps raw input data into a high-dimensional, linearly separable feature space. Subsequently, LSSVM performs the final efficient classification or regression within this space. This architecture ingeniously combines the strengths of CNN in feature learning with LSSVM’s exceptional generalization performance on small samples.
Within this optimized framework, the primary control parameters in the CPO algorithm are the defense probability (Pd), fitness value (α), and population diversity (γ). Through sensitivity analysis experiments (orthogonal experimental design) on parameters like Pd in the CPO algorithm to determine optimal biological behavior probability and perceptual weight, we found that Pd = 0.7, α = 0.55, and pop = 50 yield the fastest convergence, highest accuracy, and best diversity, as shown in Table 12.
Through range analysis, we further quantified the impact of each parameter on performance metrics. The results revealed significant variations in the influence of different parameters across performance indicators. As shown in Table 13, the defense probability (Pd) exerted the most pronounced effect on algorithm performance, consistent with its crucial role in balancing exploration and exploitation within the Crown Porcupine Algorithm. The perception weight α follows in importance, while the population size has a relatively minor impact; however, it still requires a reasonable configuration in practical applications.
Based on the Pareto Front multi-objective optimization analysis method, we selected the optimal configuration scheme that simultaneously optimizes convergence speed and accuracy. Pareto analysis identifies the optimal balance point among multiple conflicting objectives, ensuring the selected parameter configuration achieves high performance across all aspects. The final optimal parameter configuration is: Perception weighting α:β:γ = 0.55:0.30:0.15 (the optimized weighting ratio enhances information utilization efficiency); Population size pop: 50 (this size achieves an optimal balance between computational efficiency and search effectiveness). This configuration significantly improves the algorithm’s convergence speed and solution quality while maintaining population diversity.
We validated the effectiveness of the CPO algorithm’s optimization by analyzing the dynamic trajectories of LSSVM hyperparameters during the optimization process. As shown in Fig. 16, the regularization parameter γ and the RBF kernel parameter σ exhibit clear and reasonable evolutionary patterns with the number of iterations: γ converges rapidly to around 7.5 within the initial iterations (within 10 generations), demonstrating excellent rapid parameter positioning capability; simultaneously, σ exhibits a monotonically decreasing trend, ultimately stabilizing at 8.5. This optimization process demonstrates that the CPO algorithm efficiently coordinates model complexity (controlled by γ) with feature mapping relationships (controlled by σ), enabling LSSVM to maintain sufficient data feature fitting capability while avoiding overfitting.
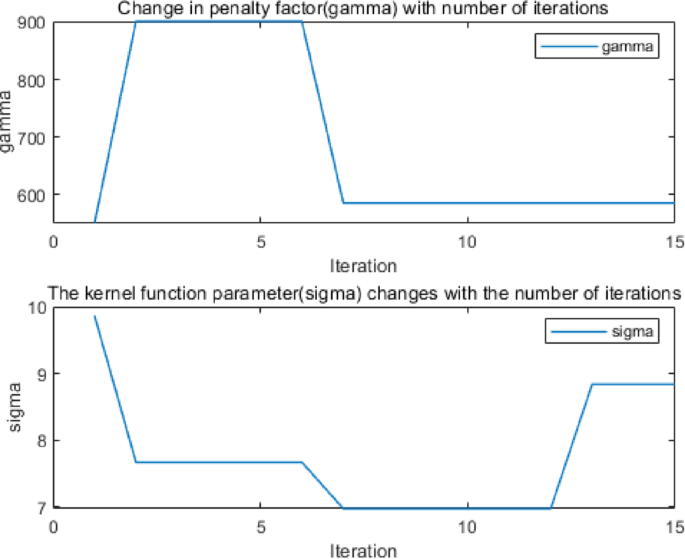
Iteration of kernel function with penalty factor.
Finally, to systematically validate the training effectiveness and generalization capability of the CPO-CNN-LSSVM model under limited sample sizes, we designed a progressive sample size performance test. By randomly sampling training subsets of varying sizes (40–160 samples), we evaluated the model’s performance changes on a fixed test set (80 samples). The experimental results are shown in Table 14, and the performance trends are illustrated in Fig. 17.
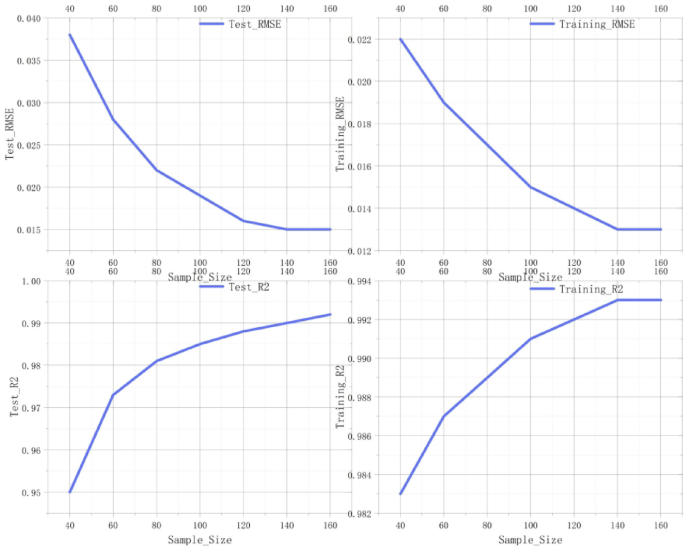
Analysis indicates that when the training sample size increases from 40 to 120, model performance improves rapidly and stabilizes: the test set RMSE decreases significantly from 0.038 to 0.016 (a 57.9% reduction). In comparison, R2 increases from 0.950 to 0.988 (a 4.0% increase). Crucially, when the sample size increased further from 120 to 160, the performance improvement became negligible (RMSE improved by only 0.001, R2 increased by 0.004), indicating that 120 training samples had brought the model’s performance close to its convergence limit. Furthermore, the training-to-test performance gap—a key metric for overfitting—consistently narrowed with increasing sample size, decreasing from 74.1% at 40 samples to 14.3% at 120 samples. This fully validates that our minimalist CNN architecture and CPO regularization strategy jointly ensure the model’s exceptional generalization capability under small-sample conditions.
In summary, combining the minimalist CNN architecture design (total parameters: 6,240; parameter-to-sample ratio: 52.0) with the above systematic validation results confirms that 120 training samples are sufficient to train the CPO-CNN-LSSVM model fully. This enables it to achieve near-optimal predictive performance, fully meeting the design prediction requirements of this study.
Experimental results
During the prediction process, the dataset for the “Zhiwen” dimension was preprocessed by first normalizing the raw data to mitigate the influence of scale differences on model training. The data matrix was then transposed to conform to the input structure required by the CPO-CNN-LSSVM model. The model parameter settings utilized the results from the parameter analysis conducted during the preliminary experimental phase.
The trend of the optimal fitness value during model training is shown in Fig. 18. The upper curve, representing the Root Mean Square Error (RMSE), exhibits a high error during the initial phase (generations 0–25), indicating that the model had not yet effectively learned to extract data features. Between generations 25 and 40, the RMSE decreased rapidly, which indicates a significant improvement in the model’s learning capability. After generation 40, the curve stabilized, suggesting that the model had converged to an optimal state. The lower loss curve shows that both the training loss (blue) and validation loss (orange) converge after epoch 40, demonstrating the model’s strong generalization capability. The training process validates the effectiveness of the CPO algorithm for feature optimization and confirms the proficiency of the CNN in feature extraction.
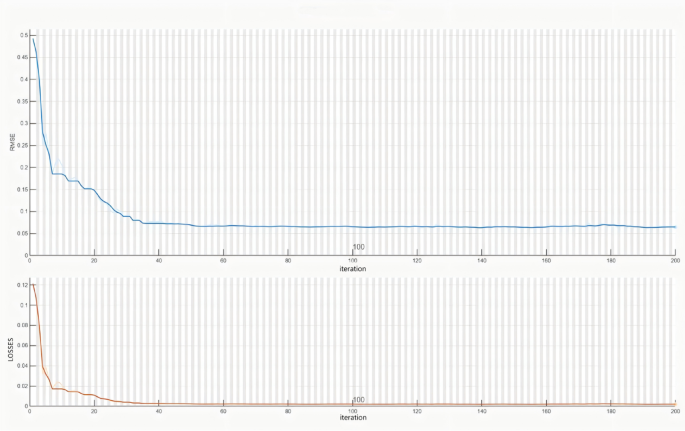
CPO-CNN-LSSVM model iterative process.
The optimized features were subsequently used as input to the LSSVM for training. The model’s performance was evaluated on test sets representing three user types, as detailed in Fig. 19. The overall linear fitting results, presented in Fig. 20, demonstrate that the CPO-CNN-LSSVM model establishes a robust mapping relationship between innovative fan design features and user affective factors.
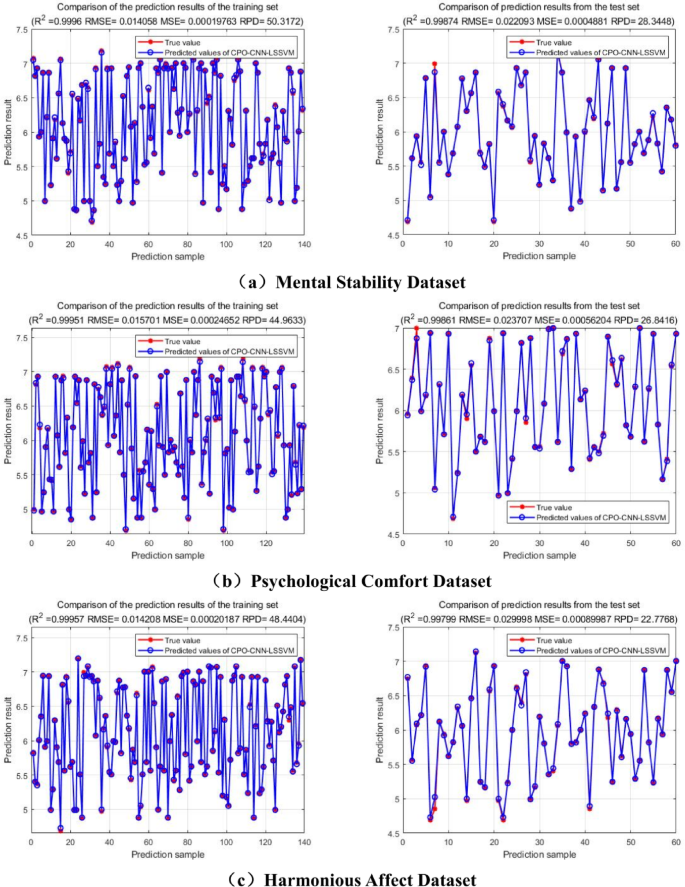
Performance Evaluation of the CPO-CNN-LSSVM Model on the User Sentiment Dataset. a to c Performance comparison between the training and testing sets for the Mental Stability, Psychological Comfort, and Harmonious Affect datasets.
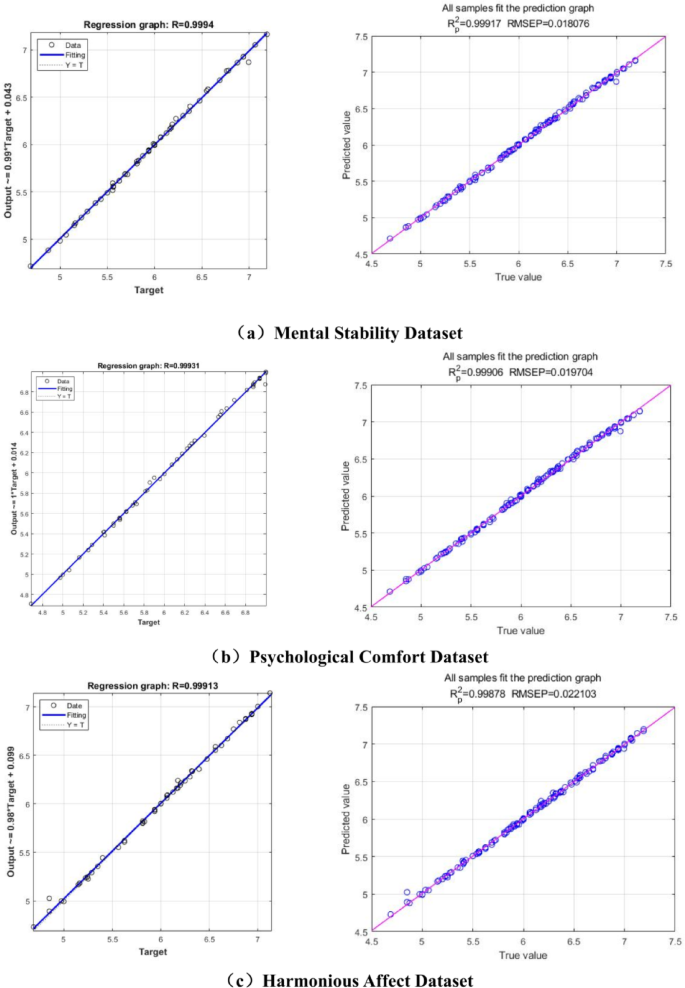
Model Bus Fitting for User Sentiment Dataset. a to c Linear fitting plots for the Mental Stability, Psychological Comfort, and Harmonious Affect datasets, respectively.
In comparison to other optimization algorithms, the proposed CPO-CNN-LSSVM model demonstrates several distinct advantages. The model’s strengths are primarily manifested in its feature extraction and optimization capabilities. The CNN component automatically captures local correlations and spatial hierarchical features in the data, thereby providing high-quality feature representations for subsequent regression analysis 38. Building on this, the Least Squares Support Vector Machine (LSSVM) component leverages its convex optimization properties 39 to ensure convergence to a global optimum, thereby effectively mitigating the risk of local optima. Furthermore, by minimizing structural risk, the LSSVM endows the model with excellent generalization capability and robustness, enabling it to maintain stable performance even with limited data or in the presence of noise.
A critical advantage is the integration of the Crested Porcupine Optimizer (CPO), which automates the hyperparameter optimization process. The CPO algorithm employs adaptive search strategies to identify optimal configurations for both CNN architectures and LSSVM kernel parameters, thereby significantly reducing the reliance on manual tuning and enhancing model reproducibility and usability 40.
This integrated, end-to-end optimization framework not only maximizes model performance but is particularly well-suited for industrial regression problems requiring high accuracy and stability, owing to its efficient training speed and strong noise resistance. Thus, it provides a reliable solution for modeling complex nonlinear relationships.
Figure 20, the horizontal axis (x-axis) represents the actual observed values, the vertical axis (y-axis) represents the model-predicted values, and the purple line denotes the ideal fit (y = x). This scatter plot with a fitted line provides a visual representation of the model’s goodness of fit. The model’s coefficient of determination (R2) consistently exceeded 0.9 across predictions, approaching a value of 1, which indicates excellent fit and explains the vast majority of the variance in the sample data 41,42. Similarly, the root mean square error of prediction (RMSEP) remained consistently low, further validating the model’s high predictive accuracy. Figure 15 demonstrates that most data points (blue) are clustered closely around the ideal fit line, indicating high predictive accuracy for the majority of samples.
Using the fully trained CPO-CNN-LSSVM model, four new design feature combinations were introduced, and emotional prediction values were generated for 30,000 smart fan design variants. Among these, Design Combination #1768 achieved the highest predicted user emotional rating (8.45). This result not only provides data-driven support for the creative design of smart fans but also validates the effectiveness and practical value of the CPO-CNN-LSSVM model in industrial design and engineering applications.
Emotional data prediction for traditional patterns based on CPO-CNN-LSSVM
Dataset construction
To systematically analyze the nonlinear relationship between Miao ethnic style characteristics and product design, a panel of 150 evaluators was recruited. The panel comprised 28 experienced designers, 30 industrial design professors, 30 graphic design professors, and 22 Miao intangible cultural heritage inheritors. A Kendall’s W coefficient test indicated a high inter-rater reliability of 0.89 (p < 0.001), demonstrating strong consistency in the evaluation outcomes.
Affective evaluations were conducted on 200 smart fan product samples using a 1–5 point scale across four design characteristics, thereby constructing the foundational dataset. Subsequently, morphological coding was performed, which identified the eight most prevalent Miao-style features: Cross-Stitch (F15), Meaning of Life (F13), Symmetry (F2), Narrativity (F10), Figurative Form (F9), Continuity (F16), Pictographic Symbols (F6), and Richness (F11). These features were then integrated with the affective evaluation data into a mapping matrix (Table 15) to systematically analyze the complex relationships between stylistic features and user perceptions.
The established CPO-CNN-LSSVM model architecture was further employed to investigate the complex mapping relationship between Miao ethnic style features and innovative fan product design characteristics. For this phase, the input features consisted of the encoded scores for 200 Miao-style features. The output responses were defined as the evaluators’ average ratings for the three emotional dimensions: “Intelligent Stability,” “Emotional Comfort,” and “Harmonious Charm.”
Consistent with the previous data partitioning strategy, the first 120 samples were allocated to the training set, and the remaining 80 samples constituted the test set. This methodology successfully produced a predictive model that effectively represents the nonlinear relationship between Miao ethnic style features and product design characteristics.
Experimental results
During the prediction process, the raw data for a given component (e.g., the bracket) were first normalized to mitigate scale differences. The data matrix was then transposed to conform to the input structure of the CPO-CNN-LSSVM model. The model parameter settings utilized the results from the parameter analysis conducted during the preliminary experimental phase.
The features optimized by the CPO algorithm were used as input to the LSSVM for training the model. The experimental results, shown in Fig. 21, demonstrate the relative impact of the four categories of design features on model performance.
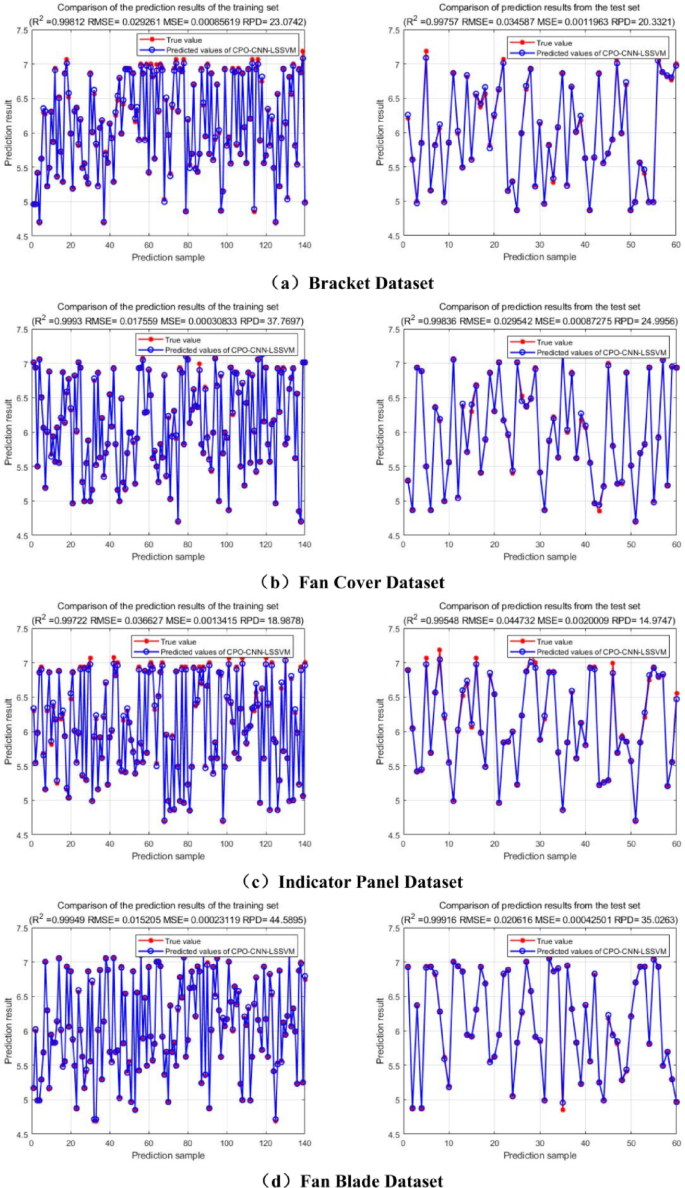
Performance Evaluation of the CPO-CNN-LSSVM Model on the Designed Feature Dataset. a to d The performance comparisons between the training and testing sets for the Bracket, Fan Cover, Indicator Panel, and Fan Blade datasets.
The overall linear fitting results, presented in Fig. 22, indicate that the CPO-CNN-LSSVM model achieves an excellent fit between product design features and Miao ethnic style features. The model’s coefficient of determination (R2) consistently exceeded 0.9, approaching 1.0, which indicates that the model explains the vast majority of the observed variance. Similarly, the Root Mean Square Error of Prediction (RMSEP) remained consistently low, further confirming the model’s high predictive accuracy. The close clustering of most data points (blue) around the fitted line in Fig. 22 reflects accurate predictions for the majority of samples.
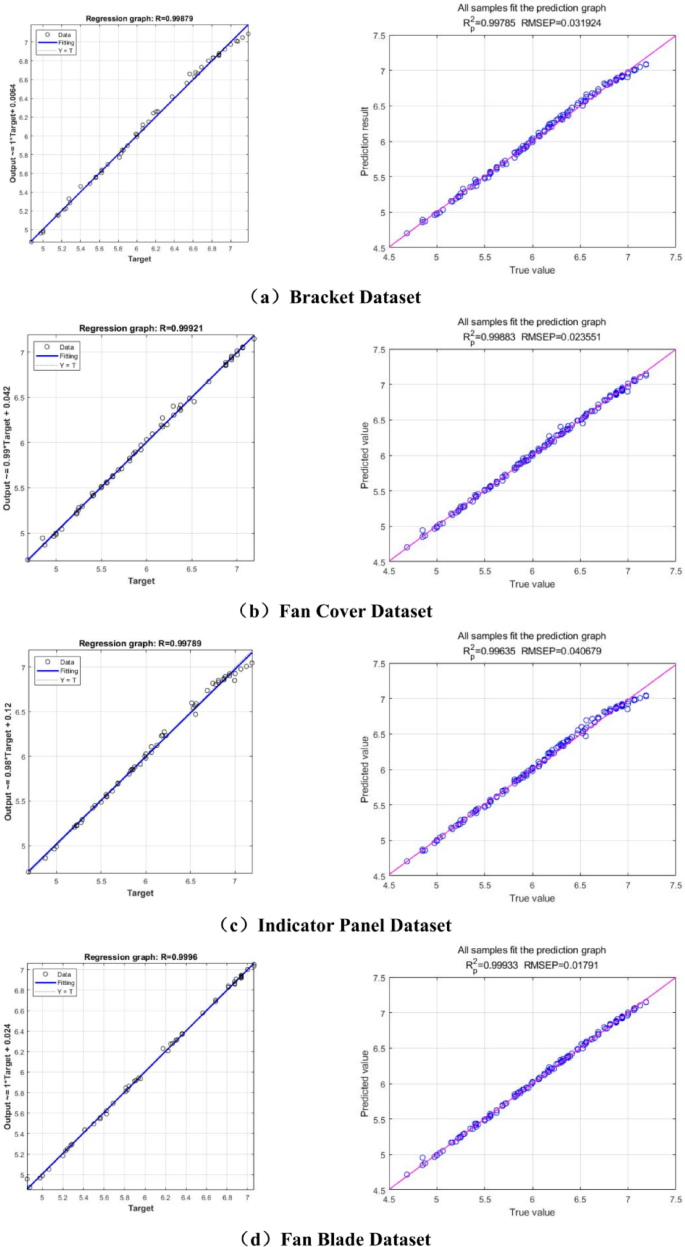
Model bus fitting for design feature dataset. a to d Lsinear fitting plots for the Bracket, Fan Cover, Indicator Panel, and Fan Blade datasets, respectively.
Following training, eight new style feature combinations were input into the model to generate emotional prediction values for 50,000 design variants. The Miao ethnic style combination #3744 achieved the highest predicted user emotional rating (9.11), confirming its suitability as the optimal style scheme for preliminary design feature selection. This outcome not only provides a crucial reference for clever fan design but also validates the application value of traditional Miao ethnic style features within modern industrial design.
Design practice
Practice process
In this phase, the previously identified optimal design features and Miao ethnic style elements were integrated into the design implementation. The product modeling was performed using Rhino 9, and rendering was completed using KeyShot 11.
The design implementation focused on a temperature-controlled fan as a prototype for a smart home product. This fan was selected for its alignment with household needs, including compact size, ease of use, durability, and low cost. A color palette of black, blue, and brown was adopted. These hues were chosen to reflect the distinctiveness of Miao culture while ensuring harmony with overall home environments. Morphologically, the design drew inspiration from the iconic form of the Miao long drum, which was skillfully integrated into the fan’s main body to highlight the unique charm of Miao culture. For decorative elements, auspicious totem patterns from Miao culture were selected. These motifs were artistically adapted and transformed for integration into the fan’s ornamental design, thereby infusing the product with a rich ethnic cultural atmosphere. Prioritizing safety, non-toxicity, low cost, and durability, ABS plastic was selected as the primary material to ensure safe usage.
The design process prioritized the integration of distinctive Miao cultural elements. Iconic symbols, such as the sun god, tree motifs, and floral patterns, were innovatively incorporated into the fan’s design. This approach not only enriches the product’s cultural depth but also enhances its artistic value, thereby addressing the emotional connection that users have with traditional ethnic patterns. Functionally, the fan incorporates innovative voice recognition technology, which significantly improves operational convenience and user experience. Additionally, the unique pattern design on the fan’s outer ring incorporates LED lighting whose intensity automatically adjusts with fan speed, creating a dynamic and engaging living environment.
Design outcomes
Kansei engineering is pivotal in smart home product development, as it focuses on the systematic analysis of users’ sensory experiences and emotional responses. This analysis strengthens the emotional connection between users and products, thereby enhancing aesthetic quality, user satisfaction, and ultimately, market competitiveness. The integration of traditional cultural elements with modern innovative products is particularly valuable, as it facilitates cultural preservation while significantly enhancing the visual and sensory experience. Therefore, developing such products requires careful consideration of the appropriate application of cultural elements, fluidity of form lines, and harmonious proportions.
Previous studies have primarily relied on qualitative analyses for evaluating the aesthetic attributes of smart home products, often lacking robust quantitative methodologies. Although design parameter adjustments can significantly impact downstream processes, research systematically exploring product configurations from a green design perspective remains limited. To address this gap, this study introduces an integrated framework combining FAHP, FQFD, and CPO-CNN-LSSVM during the early stages of product development to determine the optimal design combination based on key emotional factors.
Using a smart home fan as a case study, the FAHP method was applied to analyze user emotional needs and perceptions of Miao ethnic style characteristics. Core emotional and stylistic features were quantitatively extracted, leading to the identification of three key perceptual dimensions: “Intelligent Stability,” “Emotional Comfort,” and “Harmonious Charm.” To connect these dimensions with product design features, a morphological analysis was conducted, identifying six categories of design characteristics encompassing 100 specific manifestations. To manage the complexity arising from feature diversity, the FQFD method was employed to select four key functional features (stand, fan cover, indicator panel, and fan blades) and eight key Miao ethnic style features (e.g., cross-stitch, symmetry, and pictographic symbols).
By mapping these datasets within the LSSVM framework, a novel bright fan design concept was developed to predict and recommend optimal design configurations. The analysis demonstrated that a specific configuration (Model 7 for the bracket, Model 5 for the fan cover, and Model 6 for both the indicator panel and fan blades), combined with the eight Miao-style features, effectively satisfies user emotional needs and significantly enhances the sensory experience of the smart fan.
link